Science Blog: Studying the graphitization temperature and degree of graphite crystallinity with Raman spectroscopy
Introduction
Previous studies have demonstrated that Raman spectroscopy is an excellent tool for studying the degree of graphitization of carbonaceous material (CM), a method that in the case of metamorphic processes is independent of pressure but strongly dependent on temperature. Recently, natural graphite has come to be considered as a promising anode material for lithium ion batteries due to its high reversible capacity, appropriate charge/discharge profile and low cost. This text focuses on Raman measurements of graphite with examples from Rautalampi and Käpysuo, Central Finland. It briefly comprises the experimental background, an evaluation of the Raman data and the calculated graphitization degrees, which can be used to estimate the metamorphic crystallization temperatures of CM in the rocks.
The highest potential for finding flake graphite, which is the economically most valuable form of graphite, is restricted to areas of high metamorphic grade, such as upper amphibolite and granulite facies terrains. The best locality to study the setting of the graphite deposits is the enclosing schist and gneiss rocks in Rautalampi and Käpysuo areas, which are situated in the Savo Schist Belt (SSB), and adjacent to the Archean craton (Lahtinen, R. 1994).
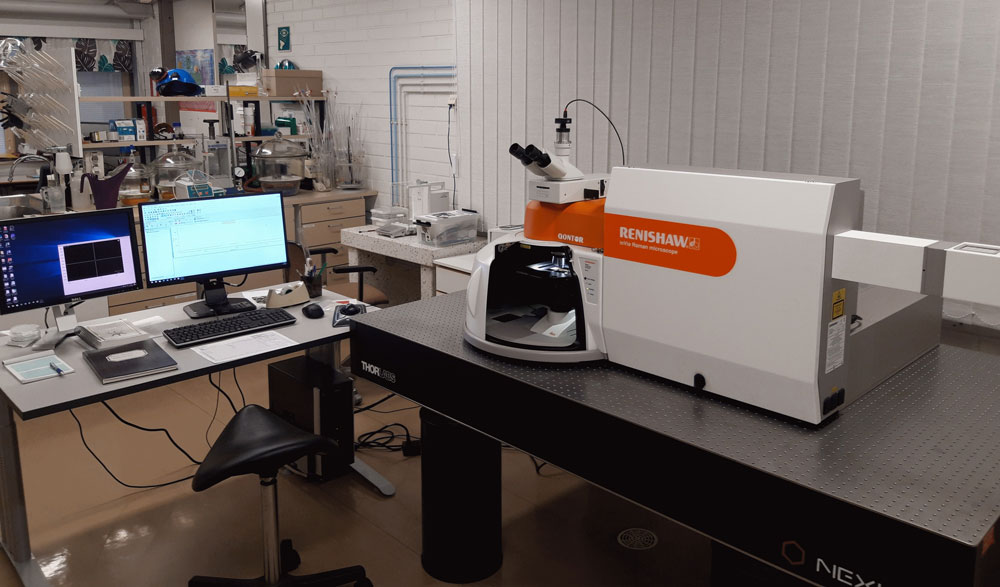
The Raman spectra were obtained from 35 petrographic thin sections of graphite-bearing rocks and 6 polished sections of cleaned graphite flotation concentrate. It was therefore possible to perform in situ point measurements and detailed studies on the textural relationships between graphite flakes and the surrounding mineral matrix. Raman investigations of graphite flakes were performed using a Renishaw inVia Qontor confocal Raman microscope w/ Leica DM 2500M 5x, 20x, 50x, 100x, equipped with a multiline argon-ion laser (785/532 nm) at the GTK Mintec mineral processing laboratory, Outokumpu (Fig. 1). Spectra were collected using the 532 nm laser at room temperature in backscattering geometry with a laser power of about 5 mW (to avoid graphite damage) and a spectral resolution of approximately 2 cm-1. Spectra were calibrated using the 520.6 cm-1 line of a silicon wafer.
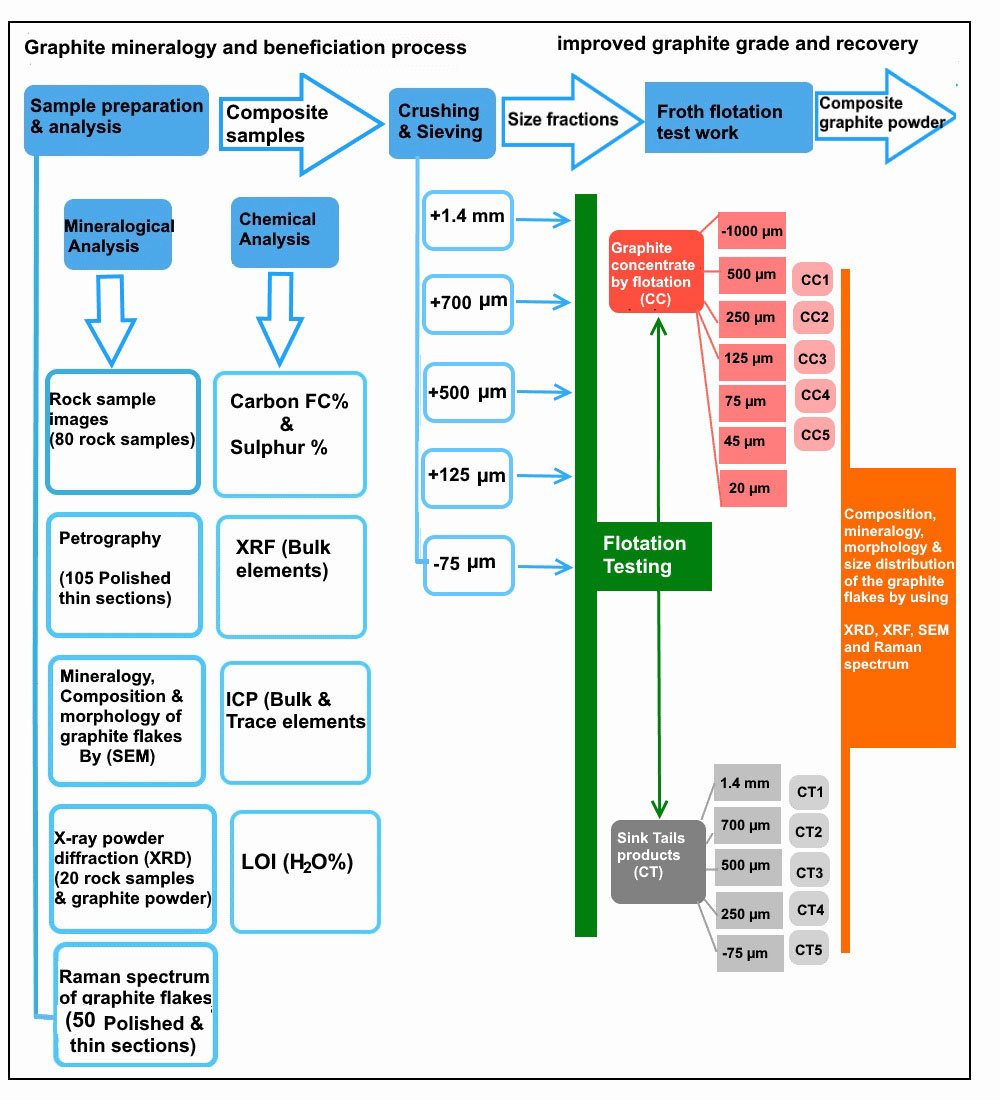
Rock specimens were also studied using optical microscopy, scanning electronic microscopy (SEM), X-ray powder diffraction (XRD) and X-ray fluorescence (XRF). The graphite flotation was carried out by combining a simple rougher flotation step with five stages of cleaning in the laboratory of the Geological Survey of Finland (GTK) at Outokumpu. Figure 2 illustrates the experimental procedure of graphite mineralogy and the beneficiation process.
Graphite Mineralogy
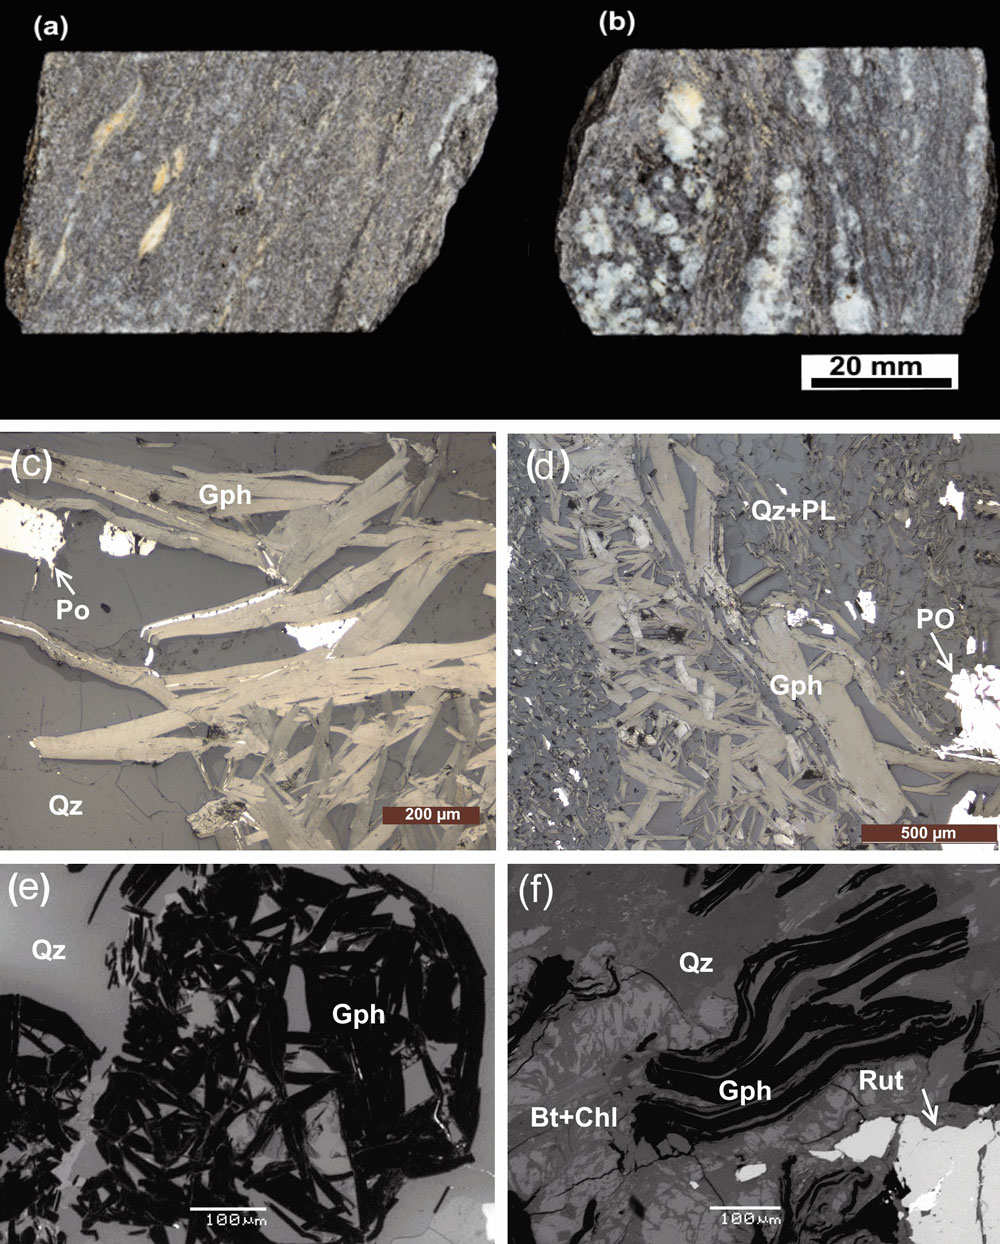
Graphite was found in two main rock types in the sampling area: quartz-mica schist and feldspathic biotite gneiss (Fig. 3a, b). The petrography studies indicate that the graphite-bearing rocks consist of quartz, feldspar and graphite with biotite. The feldspar is variably retrogressed to sericite, and biotite is retrogressed to chlorite (Fig. 3c–f). The graphite flakes vary in size and are up to 1.2 mm in length (Fig. 3c, d). The flakes are both evenly distributed in the rock and concentrated in fractures and along the foliation. Three graphite morphologies were observed: (1) euhedral to subhedral, large (>1 mm) and tabular flakes (Fig. 3c); (2) subhedral, small (0.2–1 mm) deformed graphite flakes intergrown with chlorite (Fig. 3d, e); and (3) fine-grained, or less commonly, acicular, highly lustrous graphite grains (Fig. 3d). The first two morphologies locally have alkali feldspar reaction rims in contact with plagioclase and quartz, and commonly have biotite intergrowths (Fig. 3c, d). The fourth morphology is non-pleochroic and oriented parallel to the foliation (Fig. 3d). The SEM images also demonstrate that all the samples consist of flaky graphite, i.e., that each graphite flake consists of several layers, with regular and irregular flake edges and clean flake surfaces (Fig. 3e, f).
X-ray diffraction data on flake graphite from Rautalampi and Käpysuo yielded interlayer spacings between successive carbon layers (d002) very close to that of the ideal hexagonal graphite structure. XRD results indicated minor differences in the interlayer spacing of graphite, ranging from 3.352 to 3.357 Å depending on the crystal morphology. From these values, the crystallite sizes along the stacking direction of the carbon layers within the structure are in the range of 1200 to 750 Å.
The X-ray fluorescence (XRF) analysis for the raw ore and contents of the gangue minerals is presented in Table 1, showing that the main compositions are SiO2, Al2O3, Fe2O3, CaO, K2O, MgO, SO3 and Na2O. In addition, the raw ore was analysed to have carbon content of 15.5%.
Table 1. Chemical and mineralogical composition of the raw ore (wt%).
| Composition | SiO2 | Al2O3 | Fe2O3 | SO3 | K2O | TiO2 | P2O5 | BaO | MgO | CaO |
| Content/% | 54.5 | 13.1 | 6.13 | 7.4 | 1.94 | 0.6 | 0.3 | 0.05 | 2.73 | 1.7 |
| Composition | Na2O | SrO | Cr2O3 | ZrO2 | CuO | ZnO | Y2O3 | C | ||
| Content/% | 1.5 | 0.02 | 0.03 | 0.015 | 0.013 | 0.007 | 0.002 | 15 |
| Mineral | Quartz | Feldspar | Mica | Carbonate | Pyrite | Chlorite | Apatite | Graphite | Others |
| Content
% |
35.4 | 25.4 | 15.5 | 4.3 | 4.5 | 1.1 | 0.6 | 12.5 | 0.5 |
Raman microscopy
The Raman shift for graphite is divided into first- and second-order regions after Reich &Thomsen (2004). The first-order region lies in the range of 1100 to 1800 cm-1, and the main graphite band, the G band, is at ~1582 cm-1. This band is inherent in graphite lattices. For more poorly crystalline graphite, additional bands are recognizable at ~1355 cm-1 and ~1622 cm-1. The band at ~1355 cm-1 is referred to as the main defect band (D1 band). This band occurs when defects are present in the carbon aromatic structure (Beny-Bassez & Rouzaud, 1985). It is also sensitive to graphite intercalations (Dresselhaus et al., 1988). The D2 band at ~1622 cm-1 appears as a shoulder peak of the G band and is also absent in highly crystalline graphite (Beyssac et al., 2002).
The second-order region from 2200 to 3400 cm-1 includes several bands at ~2400 cm-1, ~2700 cm-1 and ~2900 cm-1, depending on the degree of graphite crystallinity. The S1 band at ~2700 cm-1 splits into two bands at high crystallinities. It is therefore the most important indicator band for graphite crystallinities in the second-order region.
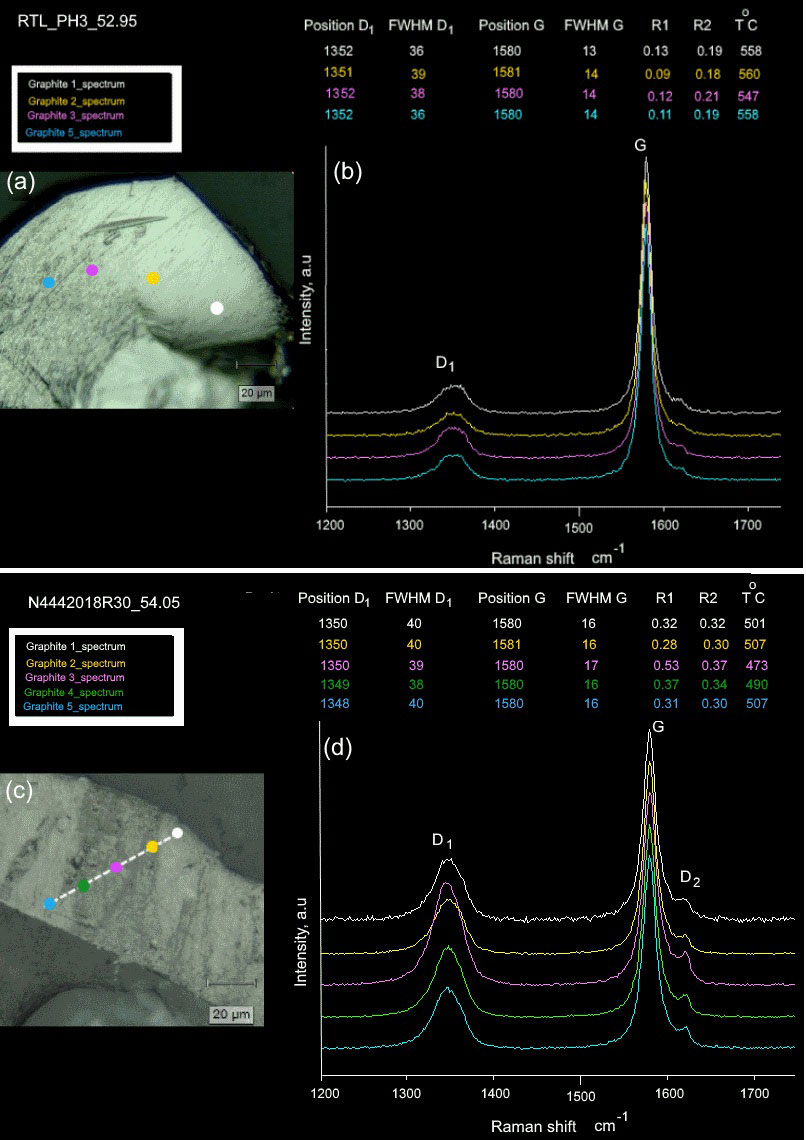
In general, Raman spectra for well-crystallised graphite include the existence of D1 and D2 bands in the first-order region (Wopenka & Pasteris, 1993). Thus, the relative intensity ratio of D and G bands (R1 = D1/G) can be used as an indicator of the degree of graphite crystallinity, and these values can be applied to calculate the La value of the crystal size (Tuinstra & Koenig, 1970; Pimenta et al., 2007). To estimate the peak of the metamorphic temperature, Beyssac et al. (2002) employed the parameter R2, defined as the area ratio (R2 = D1 ⁄ (G + D1 + D2), and proposed the formula TGr (°C) = −445 x R2 + 641 as a thermometer for Raman spectroscopy of carbonaceous material (RSCM) for regional metamorphic rocks in the range of 330–640 °C. Spectral parameters were determined by a background fitting process and the corresponding data are presented in Figures 4 and 5 and Table 2. The dataset of Table 2 includes mean values for the centre position, the FWHM of the D1 and G bands, values for the D1/G intensity and peak area (D1⁄ (G + D1 + D2) ratios, the La value and the calculated graphitization temperature.
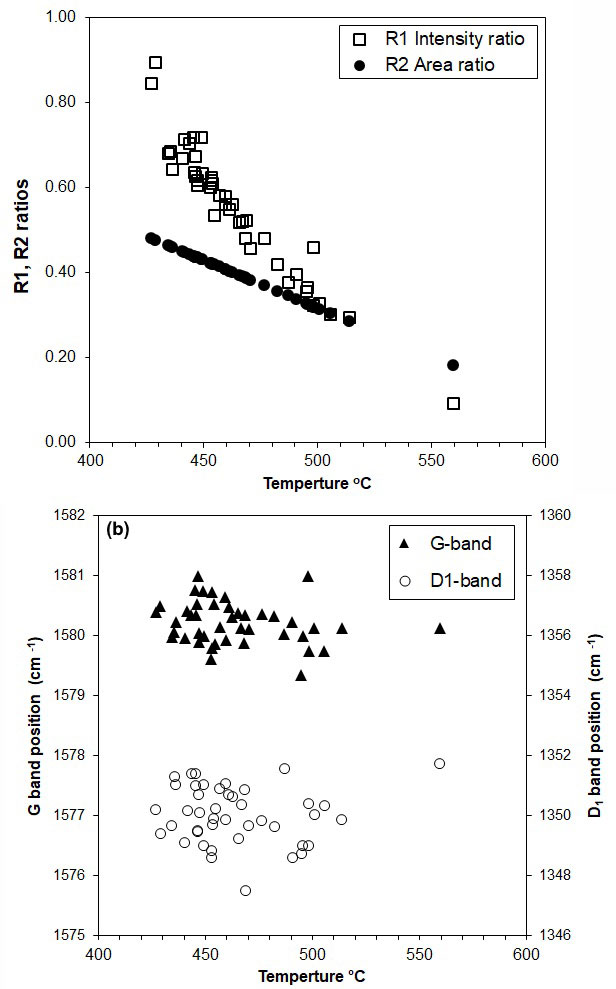
The average intensity (R1) and peak area (R2) ratios for the studied graphite flakes in more than 50 graphite-bearing rocks range from 0.09 to 0.90 for R1 and 0.18 to 0.48 for R2. As the degree of graphitization increases, the graphite band (G band) in the Raman spectra becomes sharper and the disorder band (D band) derived from turbostratic graphite structures becomes weaker relative to those of low-grade graphite (Nakamura & Akai, 2013; Bernard et al., 2010). Temperature estimates for the studied graphite flakes from the “graphitic schists” of the Rautalampi and Käpysuo areas in Central Finland range from 430–560 °C. In sample RTL_PH3_52.95, with the highest temperature of 560 °C, the Raman spectra of graphite flakes show a strong G band with quite a broad D1 band and an almost undetectable D2 band, implying that the graphite flake is well crystalline, and both R1 and R2 ratios show decreased values (0.09 and 0.18, respectively). We refer to this type of graphite metamorphosed at around 450 °C to 560 °C as high grade (Fig. 4a,b).
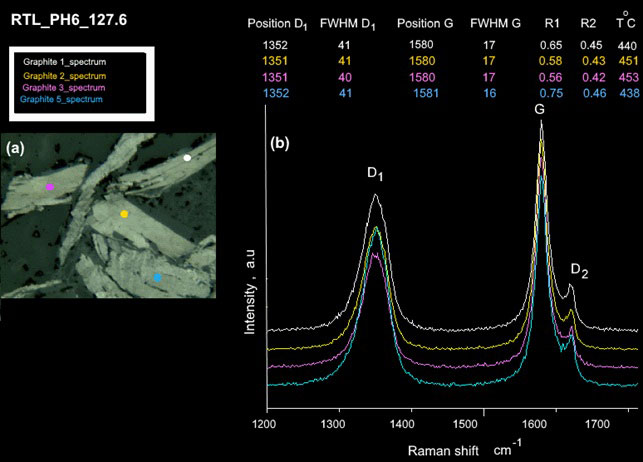
The shapes of the Raman spectra of graphite flakes for sample RTL_PH6_127.6 (Fig. 5) are very similar to those of high-grade graphite samples, but exhibit high intensities of D1 and D2 bands, while both the D1/G intensities and area ratios (R2) show abrupt increases (Fig. 5a, b). These results are in agreement with the suggestion above that the values of the D1/G intensity (R1) and area ratios (R2) display parallel trends, which increase along with the decreasing metamorphic temperature from 0.60 to 0.90 and 0.42 to 0.48, respectively. We refer to this type of graphite metamorphosed at around 450 °C to 430 °C as medium-grade graphite.
Figure 5 shows the relationships between Raman spectrum parameters, R1 and R2 ratios and the estimated temperature, with the R2 ratios having a decreasing trends with temperature. This indicates that the values of the D1/G intensity and area ratios show parallel trends, which decrease as a function of increasing metamorphic temperature from 0.9 to 0.09 and 0.48 to 0.18, respectively (Fig. 6a). It also implies that the graphitization temperature tends to increase as the graphite crystallinity increases. The values of the centre positions of the D1 and G bands slightly decrease with increasing metamorphic temperature from 1352 to 1348 cm−1 and 1581 to 1579 cm−1 (Fig. 6b).
Table 2. Average parameters obtained from the Raman spectra of thermochemically extracted graphite cuboids from different localities. R1 = D1/G peak intensity (i.e., peak height) ratio, R2 = D1/(G + D1+D2) peak area ratio, TGr (°C)= −445 x R2 + 641 (Beyssac et al., 2002).
| Samples | Peak Position | FWHM | R1 | R2 | La(Å)* | TGr (°C)* | ||
| D1 | G | D1 | G | |||||
| RTL_PH3_52.95_2 | 1352 | 1580 | 37 | 14 | 0.09 | 0.18 | 476 | 560 |
| M2143_98_R330_67.3_2 | 1350 | 1580 | 40 | 16 | 0.29 | 0.29 | 153 | 515 |
| RTL_PH11_58.85_4 | 1350 | 1580 | 41 | 16 | 0.3 | 0.3 | 148 | 505 |
| N4442017R27_102.3_2 | 1349 | 1581 | 40 | 17 | 0.63 | 0.42 | 85 | 453 |
| RTL_PH9_187.0_2 | 1349 | 1580 | 41 | 17 | 0.6 | 0.42 | 74 | 453 |
| RTL_PH13_175.6_2 | 1349 | 1580 | 40 | 16 | 0.63 | 0.43 | 70 | 450 |
| RTL_PH6_127.6_2 | 1351 | 1580 | 41 | 17 | 0.64 | 0.44 | 70 | 446 |
| RTL_PH3_152.0_3 | 1349 | 1580 | 42 | 17 | 0.9 | 0.48 | 50 | 429 |
| RTL_PH3_152.0_1 | 1350 | 1580 | 42 | 17 | 0.85 | 0.48 | 53 | 427 |
*La (Å) and TGr (°C) are calculated by ID/IG = C(λ)La (nm) (Tuinstra and Koenig equation) and the thermometer following Beyssac et al. (2002), respectively.



Conclusions
The modified RSCM thermometer is a promising method that can be readily applied to obtain metamorphic temperature estimates. Beyssac et al. (2202) established that the thermometer is relatively insensitive to the thermal resetting and provides reliable estimates of peak metamorphic temperatures. In the Raman spectra of most of the studied samples, the highly crystallized graphite flakes (R1 = 0.1–0.4) with a high temperature range of c. 480–560 °C are characterized by a low intensity of the D1 band. By comparison, the intensity of this band in low crystallized graphite flakes (R1 = 0.5–0.9) is significantly higher, with a medium temperature range of c. 430–470 °C, being comparable with that of the G band. The FWHM values of the G bands (FWHMG = 16 cm-1) of the graphite flakes are roughly two times lower than those of the D1 bands (FWHMG = 40 cm-1). This evidence clearly indicates that most of the studied graphite is of high crystallinity, irrespective of the degree of hydrothermal alteration.
References
Beny-Bassez, C. & Rouzaud, J. N. 1985. Characterization of carbonaceous materials by correlated electron and optical microscopy and Raman microspectroscopy. Scanning Electron Microscopy 1985(1), 119-132. https://www.researchgate.net/publication/279904217
Bernard S., Beyssac O., Benzerara K., Findling N., Tzvetkov G., and Brown G.E., Jr. 2010. XANES, Raman and XRD study of anthracene-based cokes and saccharose-based chars submitted to high-temperature pyrolysis. Carbon 48:2506–2516. https://www.sciencedirect.com/science/article/pii/S0008622310001892
Beyssac, O., Goffe, B., Chopin, C., Rouzaud, J.N. 2002. Raman spectra of carbonaceous material from metasediments: A new geothermometer. J. Metamorph. Geol., 20, 859–871. https://onlinelibrary.wiley.com/doi/full/10.1046/j.1525-1314.2002.00408.x
Dresselhaus, M. S., Dresselhaus, G., Sugihara, K., Spain I. L. and Goldberg, H. A. 1988. Graphite Fibers and Filaments, Vol. 5 of Springer Series in Materials Science, Springer-Verlag, Berlin.
Lahtinen, R. 1994. Crustal evolution of the Svecofennian and Karelian domains during 2.1-1.79 Ga, with special emphasis on the geochemistry and origin of 1.93-1.91 Ga gneissic tonalities and associated supracrustal rocks in the Rautalampi area, central Finland. In: Lahtinen, R. Crustal evolution of the Svecofennian and Karelian domains during 2.1−1.79 Ga, with special emphasis on the geochemistry and origin of 1.93-1.91 Ga gneissic tonalites and associated supracrustal rocks in the Rautalampi area, central Finland. Geological Survey of Finland, Bulletin 378, 1–128. Available at: http://tupa.gtk.fi/julkaisu/bulletin/bt_378.pdf
Nakamura, Y. & Akai, J. 2013. Microstructural evolution of carbonaceous material during graphitization in the Gyoja-yama contact aureole: HRTEM, XRD and Raman spectroscopic study, · Journal of Mineralogical and Petrological Sciences, 108(3), 131-143. DOI:10.2465/jmps.120625
Pimenta, M.A., Dresselhaus, G., Dresselhaus, M.S., Cançado, L.G., Jorio, A. and Saito, R. 2007. Studying disorder in graphite-based systems by Raman spectroscopy. Physical chemistry chemical physics, 9, 1276-1291.
Reich, S. & Thomsen, C. 2004. Raman spectroscopy of graphite. Philosophical Transactions: Mathematical, Physical & Engineering Sciences, November 15, 2004, vol. 362, no. 1824, pp. 2271-2288(18). https://www.ifkp.tu-berlin.de
Tuinstra, F. and Koenig, J.L. 1970. Raman Spectrum of Graphite. Journal of Chemical Physics, 53, 1126-1130. http://dx.doi.org/10.1063/1.1674108
Wopenka, B. & Pasteris, J. D. 1993. Structural characterization of kerogens to granulite-facies graphite; applicability of Raman microprobe spectroscopy. American Mineralogist 78(5-6), 533-557.
Text: Thair Al-Ani and Akseli Torppa
Thair Al-Ani completed his Ph.D. in geochemistry and mineralogy at the University of Baghdad in 1996. He has worked as a senior scientist at the Geological Survey of Finland (GTK) since September 2003. Dr Thair Al-Ani has over 14 years of experience of academic teaching at Tripoli University, Libya (1997–2001) and Baghdad University, Iraq (1988–1997). Currently, he is engaged in many projects focusing on GTK strategies relating to graphite, lithium and cobalt as raw materials in lithium-ion battery technologies and other applications for renewable energy.
Akseli Torppa completed his M.Sc. in geology and mineralogy at the University of Helsinki in 2003. He has worked at the Geological Survey of Finland (GTK) since June 2008. Akseli Torppa has 16 years of research experience in mineralogy, geochemistry, isotope geochemistry, Precambrian and applied geology, and mining environmental issues. Since 2018, he has worked as a member of the mineralogy research group at GTK Mintec in Outokumpu, using advanced research instruments and software such as MLA, XRD and Raman. A. Torppa’s current research interests include environmental geology and process mineralogy.
