Seabed Survey Lines – One Hundred Thousand Kilometres of Geology in the Baltic Sea
The Baltic Sea has provided those of us who live along the cost with abundance: valuable natural areas by the coast and the archipelago, connections, solitude, peace of mind, recreation, nutritious food, and jobs. The shallows of the open sea, wind conditions and a stable seabed also provide a good basis for energy recovery. The ocean wind is slowly taking its first steps in its journey to emission-free and self-sustainable energy generation. What is still holding it back? The scarcity of geological background information required to support sustainable design and construction. The lack of knowledge.
Uncharted seabed
Expeditions in the Baltic Sea began in the 19th century. The aim was to understand and explore the phenomena of the sea, but the seabed underneath remained a mystery for decades. As a new research area in Finland, geochemical studies of seabed sediments began in the 1920s. Coordinated by the Finnish Institute of Marine Research, seabed samples were collected from the Gulf of Finland, the Gulf of Bothnia, and the northern Baltic Sea, all the way to the Gotland Deep. However, precise research was hampered by the inaccuracy of geospatial data: it was difficult to determine the exact location of the vessel in the open sea until the positioning technology developed during World War II found its way into civilian use.
Sediment research continued in the Finnish Institute of Marine Research until 1955, after which these studies were also conducted by the Geological Research Institute (currently Geological Survey of Finland, GTK), funded by the Finland Research Council for Natural Sciences. The Finnish Institute of Marine Research also participated in the work by providing the geologists with the resources of Aranda – an ice-reinforced research vessel built at Valmet’s shipyard in Helsinki in 1953. The new field of marine research, marine geology, had made its way to Finland, bringing revolutionary research methods such as echo sounding in its wake.
In 1969, signs of a possible oil reservoir were found on the island of Gotland. This did not go unnoticed by a Finnish oil refining company. Neste Oy turned to GTK, could there be oil in the Finnish economic zone of the Baltic Sea? Probably not, but there was no absolute certainty. Sea areas were uncharted. Appropriate survey equipment and a research vessel that could be reserved for the duration of the entire field season were missing. The aim was to keep Aranda busy all the time, summer and winter. Neste replied hastily – charting was to begin immediately. Money should not be a problem. Building and equipping a sounding vessel began.
And just like that, survey equipment perfectly suited for marine geological research was installed in the vessel. The new vessel was named Kaita. The Neste project lasted three summers in the field, but no commercially viable quantities of hydrocarbons were found from the sedimentary rock in the bedrock. However, the researchers obtained valuable information of the geology of the Bothnian Sea. An added bonus was that the sounding vessel Kaita remained at GTK’s disposal, and systematic charting of the seabed began in earnest.
First glimpses with echo sounding – the seabed landscape starts to take shape
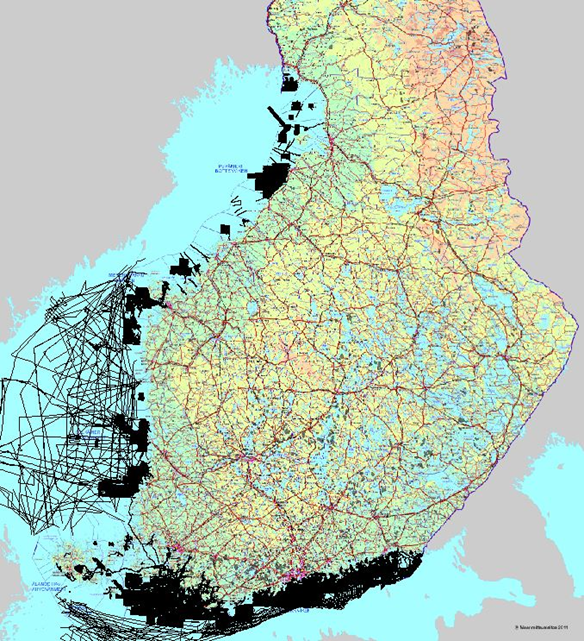
Decades went by, and the fleet was modernised, but T/A Kaita powered through until the end of its final field season in 2004, leaving behind a staggering 34,627 kilometres of sounding. All the research vessels at GTK’s disposal ‒ old Aranda (1953‒1989), Aranda (1989‒), Kaita, Geola, Kaiku, Geomari and Gridi ‒ have one hundred thousand kilometres of sounding between them.
The ‘Seabed Remote Sensing’ material contains information about marine soundings since the 1960s. The material contains geospatial data and metadata related to each sounding line, based on GTK’s seabed geology material. Methods based on acoustic-seismic sounding give an illustration of the shapes and condition of the seabed, and the thickness and internal structures of the sediment layers. A significant benefit of sounding compared to sampling is its coverage. Sampling gives information on one location only, whereas sounding methods produce regionally uninterrupted information on seabed conditions.
Although the first research soundings were carried out in the Baltic Sea in the 1950s, and the sounding material covers tens of thousands of kilometres, surprisingly little is known of the ocean floor. Only less than 25 per cent of the seabed in Finnish marine areas is geologically charted at the scale required by marine environment planning. There will be enough work for years to come. Geological data of the seabed will be even more important in the future, as it is essential in marine management and sustainable marine environment planning. The work still awaits for its performers ‒ the seabed has not yet revealed all of its secrets.
Seabed Remote Sensing – geospatial data material
The ‘Seabed Remote Sensing’ material has been compiled as part of GTK’s data collection programme, the Finnish database/portal of Baltic Sea information and knowledge project (MarineFinland.fi) funded by the European Maritime and Fisheries Fund, and EMODnet Geology project funded by CINEA (The European Climate, Environment and Infrastructure Executive Agency). The equipment of the FINMARI infrastructure for Finnish marine research has also been used in geological surveys of the seabed. The ‘Seabed Remote Sensing’ material is available and downloadable at GTK’s Hakku search and download service.
Seabed sounding methods
The most common marine geological research methods include sediment echo sounding, multibeam echo sounding, side-scan sonar imaging and seismic reflection profiling, each of which have their special uses.
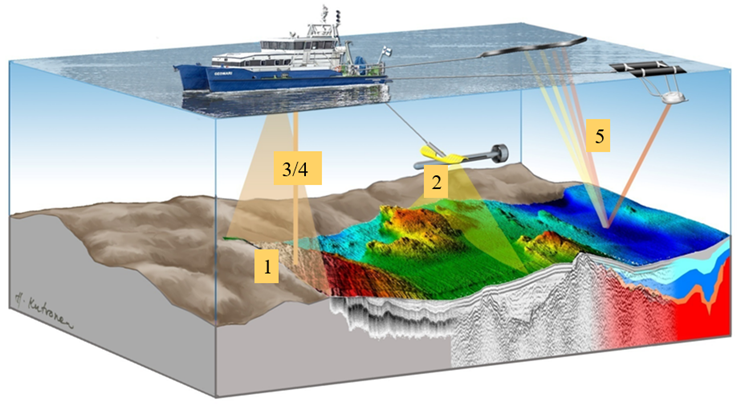
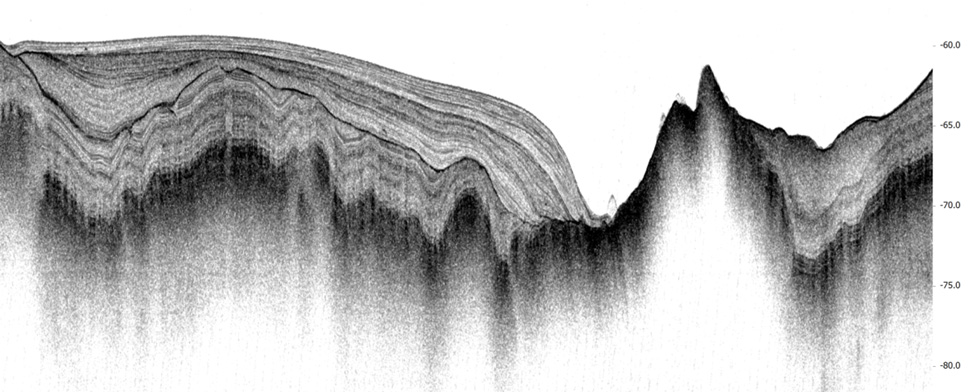
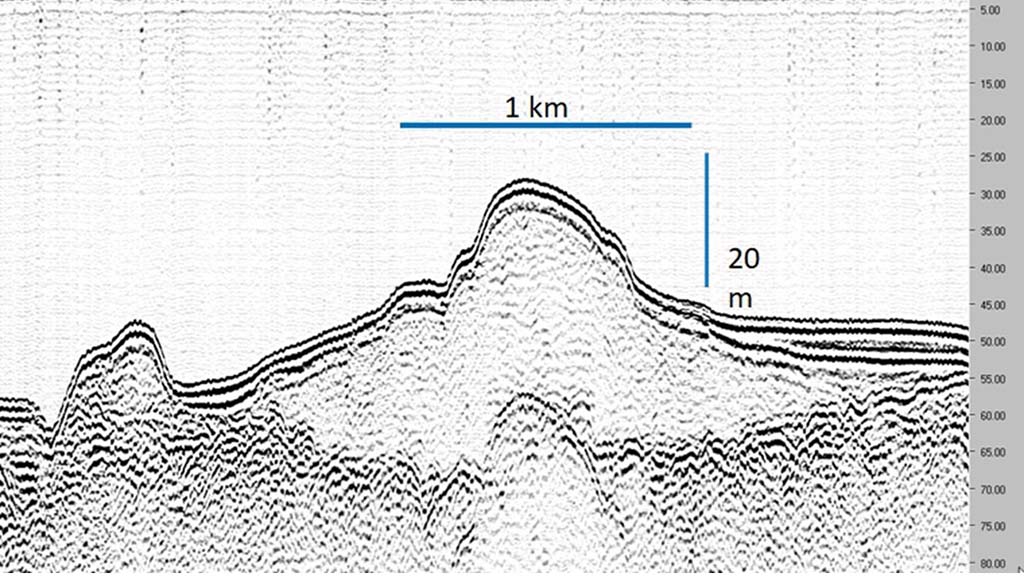
A sediment echo sounder provides information on water depth, seabed topography, and the thickness and internal structures of soft (mud and clay) sediment units. The vertical resolution of a high-frequency sonar can be a couple of centimetres. The sonar signal does not penetrate hard seabed substrates such as sand, gravel and till. Nevertheless, the echo sounding profile displays the boundary between the hard and soft substrates and gives information about the boulders at the seabed. The sensor of the sonar sends sound pulses to the seabed and receives reflected signals from the seabed and the interfaces between sediment units. The water depth and the thickness of the sediment unit are calculated based on the travel times of a sound pulse. The penetration of the signal is affected by its frequency and the consistency of the seabed sediment – the lower the signal frequency and the softer the seabed, the deeper into the sediment the signals penetrate. With high signal frequencies, the sound penetration rate is low, but the resolution is high. By using both a high and low sequence transmitter at the same time, the resolution is good and the penetration moderate in soft sediments.
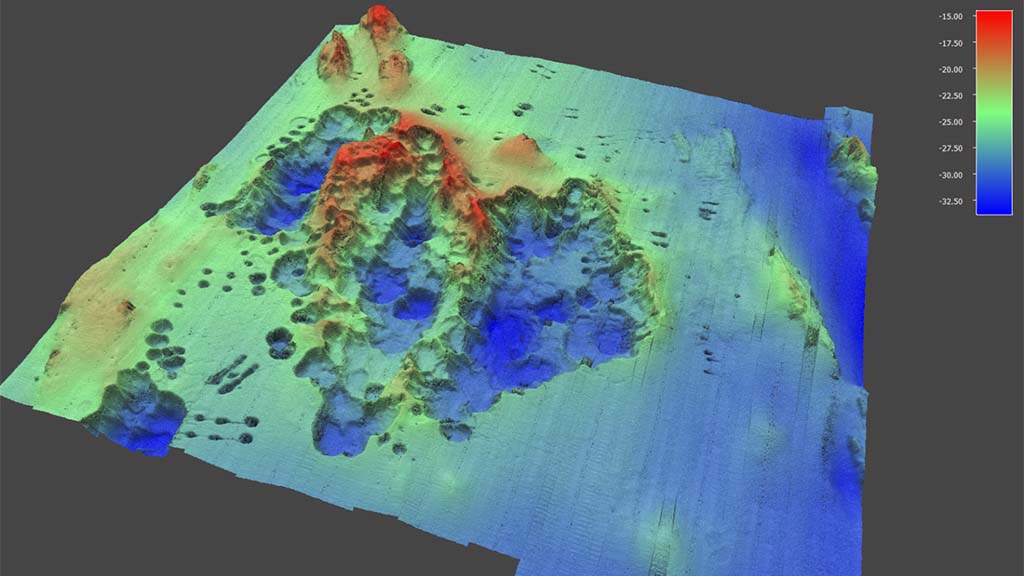
With multibeam echo sounding, it is possible to map extensive areas, as this sonar produces a fan-like coverage of the seabed using many individual sonar beams. The system measures the time it takes for the acoustic signal to travel from the transmitter to the seabed and back. Using the travel time/travel to the seabed and the measurement angle from the sonar, the exact location and depth of each sonar beam can be determined. Based on the dense point cloud created by the location and depth values, a surface model is created, giving an uninterrupted 3D model of the seabed landscape where the shapes of the seabed are shown shaded and coloured by depth. The model reveals elevations, minor pits and narrow canyons on the seabed. Based on the images, it is possible to estimate the boulders on the seabed and roughness of the seabed or the nature types in the area. The multibeam sonar images reveal the effects of dredging, dumping dredged mud or bottom trawling on the seabed. Various structures such as cables and water and sewage pipes can also be seen in the images. The benefits of multibeam echo sounding include its coverage and increased information about the details of the seabed but processing massive amounts of depth point data is arduous and time-consuming.
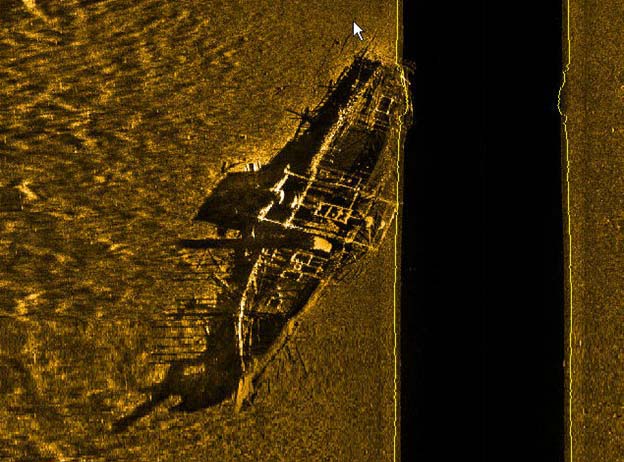
Side-scan sonar imaging produces an acoustic shadow image of the seabed surface from both sides of the research vessel. The signal returning from the seabed is registered as strong when it is reflected back from a hard surface such as rock or a boulder. Sound reflects poorly from clay and mud. The shapes of the seabed affect the travel of the return signal. The image can be used to determine erosion and sediment structures, ripple marks, seabed structures caused by gas and groundwater discharges, and evidence of human disturbance (cables, bottom trawling, dredging, dumping, sea sand extraction, etc.). Side-scan sonar imaging gives a very detailed and specific picture of the seabed surface structures and materials of the seabed and objects on the seabed. This method is often used to determine the location of wrecks. Boulders and other items like shipwrecks rising from the surface of the seabed leave an acoustic shadow behind them. The length of the shadow can be used to calculate the height of the structures from the seabed. The resulting image is much like an aerial photograph.
Seismic reflection profiling provides information about the thickness and internal structures of rough sediment units (sand, gravel, till). It also gives details about the topography of the bedrock. In addition to studying the location of the bedrock underneath the seabed, reflection seismic sounding can be used to detect tectonic elements of the bedrock, such as faults and fracture zones. The sounding uses low-frequency sound sources and a separate receiver to receive the sound wave returning from the reflecting surfaces. Seismic waves are reflected on interfaces such as the seabed and stratigraphic, lithological and geotechnical boundaries, based on the density of the units and the changes in speed of sound (acoustic impedance). A change in the speed of sound at the interface or sediments bends the sound wave, causing some of the pulse energy to be reflected and creating an interface that can be seen in an acoustic image. Seismic reflection profiling is well suited for geological research, and the method has been used since the 1960s.
Text
Ulla Alanen, GIS Specialist
Marine Geology, Environmental Solutions, Geological Survey of Finland
Aarno Kotilainen, Research Professor
Environmental Solutions, Geological Survey of Finland
Further information
Jakobsson, M., Gyllencreutz, R., Mayer, L.A., Dowdeswell, J.A., Canals, M., Todd, B.J., Dowdeswell, E.K., Hogan, K.A., Larter, R.D., 2016. Mapping submarine glacial landforms using acoustic methods. In: Dowdeswell, J. A., Canals, M., Jakobsson, M., Todd, B. J., Dowdeswell, E. K. & Hogan, K. A. (eds) 2016. Atlas of Submarine Glacial Landforms: Modern, Quaternary and Ancient. Geological Society, London, Memoirs, 46, 17–40. http://doi.org/10.1144/M46.182
Kankaanpää, H., Kotilainen A., 2008. Itämeri kaikuu historiansa kuviksi. Tiede, 6, 24–27.
Linberg, E., 1928, Åbo sjöfarts historia 3, Ångbåtssjöfarten i Åbo 1836–1928
Poutanen, E.-L., Leppänen, J.-M., 2021. Nautiluksesta Arandaan: suomalaisen merentutkimuksen tarina. John Nurmisen säätiö.
Winterhalter, B., 2016. Prolific decades of marine geology at the Geological Survey of Finland: a historical review, BALTICA, 29, 47–56.
Digital materials of the National Library of Finland: digi.kansalliskirjasto.fi